
Muslims form the largest minority community in Uttar Pradesh where they constitute around 19% of the state population with 20 districts having the Muslim concentration above 20%. Uttar Pradesh also hosts 22% of India’s Muslim population, the largest Muslim population of all states and union territories. Besides Muslim population factor, the state also has its share of Indian Muslim culture and heritage and a history of communal riots as well. But in comparison to other states, Muslims here are more deprived socially and economically. Politically, their position is worse.
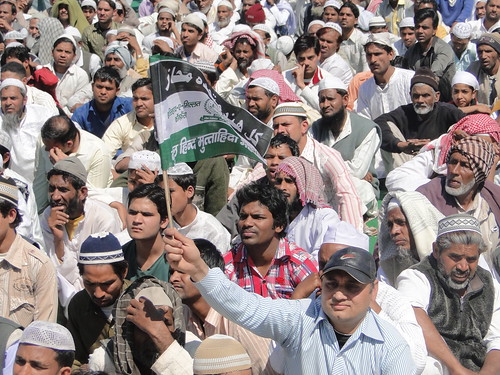
Muslims of demanding reservation at a rally held March 6, 2011 in Muzzafarnagar district of UP [TCN Photo]
The representation of Muslims in the state legislative assembly has been consistently low in proportion to their population. Whereas on other side, the Scheduled Castes, which also have the highest concentration in the state with 21% population, are represented in the assembly at par its population ratio due to the safeguard of the Indian constitution – seats are reserved for the SC community in all legislative bodies across the country according to their population.
Since the Assembly election in the state is scheduled to be held in 2012 several Muslim as well as mainstream political parties are looking to grab the maximum number of Muslim votes to increase their strength in the legislature. This piece looks into the ideal and actual Muslim representation at per their population in all districts of the state. Allocation of assembly & parliamentary constituencies is made in each state and district to ensure the proper representation of population.
Reservation of seats for SCs is also determined in proportion to their population. The Delimitation Commission demarcates the boundaries and reserves the constituencies for SCs on the population proportion basis. The Scheduled Castes in the state are 3,51,483,77 that is 21% of the total population of the state and their representation in the assembly at per their population is ensured by reserving 85 seats. These 85 seats are distributed to seventy districts as per their population share. If the criteria and methodology adopted to ensure proper representation of SCs are also used for Muslims, then the situation will be altogether different in the state assembly. In the present Assembly of Uttar Pradesh, there are 55 Muslim MLAs but in proportion to their population in the state and district-wise there should be 75 Muslim MLAs.
District
|
Total Population
|
Total Seats
|
Total Muslim Population
|
% of Muslim population
|
% of state Muslim Population
|
Entitlement of Seats as per the ratio
|
Existing seats won by Muslim
|
Moradabad
|
3810983
|
9
|
1735381
|
45.54
|
4.23
|
4
|
5
|
Muzaffarnagar
|
3543362
|
9
|
1349629
|
38.09
|
3.29
|
3
|
2
|
Bijnor
|
3131619
|
8
|
1306329
|
41.71
|
3.19
|
3
|
3
|
Bareilly
|
3618589
|
9
|
1226386
|
33.89
|
2.99
|
3
|
2
|
Saharanpur
|
2896863
|
7
|
1132919
|
39.11
|
2.76
|
3
|
1
|
Meerut
|
2973877
|
7
|
975715
|
32.81
|
2.38
|
2
|
2
|
Rampur
|
1923739
|
5
|
945277
|
49.14
|
2.31
|
2
|
2
|
Bahraich
|
2701478
|
7
|
829361
|
30.70
|
2.02
|
2
|
4
|
Ghaziabad
|
3314070
|
8
|
782915
|
23.62
|
1.91
|
2
|
0
|
Lucknow
|
3647834
|
9
|
748687
|
20.52
|
1.83
|
2
|
1
|
Sitapur
|
3619661
|
9
|
696126
|
19.23
|
1.70
|
2
|
1
|
Budaun
|
3069426
|
7
|
654797
|
21.33
|
1.60
|
2
|
1
|
Kanpur Nagar
|
4167999
|
10
|
653881
|
15.69
|
1.60
|
2
|
1
|
Allahabad
|
4936105
|
12
|
627735
|
12.72
|
1.53
|
2
|
1
|
Balrampur
|
1682350
|
4
|
617675
|
36.72
|
1.51
|
2
|
1
|
Bulandshahr
|
3009860
|
7
|
613660
|
20.39
|
1.50
|
1
|
1
|
Kheri
|
3207232
|
8
|
612638
|
19.10
|
1.49
|
1
|
1
|
Siddharthnagar
|
2040085
|
5
|
600336
|
29.43
|
1.46
|
1
|
1
|
Azamgarh
|
3939916
|
10
|
593907
|
15.07
|
1.45
|
1
|
0
|
Jyotiba Phule Nagar
|
1499068
|
4
|
590308
|
39.38
|
1.44
|
1
|
2
|
Barabanki
|
3060996
|
7
|
589197
|
19.25
|
1.44
|
1
|
2
|
Gonda
|
2765586
|
7
|
532585
|
19.26
|
1.30
|
1
|
2
|
Aligarh
|
2992286
|
7
|
531956
|
17.78
|
1.30
|
1
|
1
|
Sultanpur
|
3214832
|
8
|
524642
|
16.32
|
1.28
|
1
|
0
|
Varanasi
|
3138671
|
8
|
497516
|
15.85
|
1.21
|
1
|
1
|
Kushi Nagar
|
2893196
|
7
|
487674
|
16.86
|
1.19
|
1
|
0
|
Shahjahanpur
|
2464930
|
6
|
455049
|
18.46
|
1.11
|
1
|
0
|
Hardoi
|
3398306
|
8
|
445419
|
13.11
|
1.09
|
1
|
3
|
Jaunpur
|
3911679
|
9
|
399186
|
10.20
|
0.97
|
1
|
1
|
Pilibhit
|
1728108
|
4
|
390773
|
22.61
|
0.95
|
1
|
3
|
Pratapgarh
|
2731174
|
7
|
374126
|
13.70
|
0.91
|
1
|
0
|
Maharajganj
|
2173878
|
5
|
357822
|
16.46
|
0.87
|
1
|
0
|
Mau
|
1853997
|
4
|
353003
|
19.04
|
0.86
|
1
|
1
|
Gorakhpur
|
3769456
|
9
|
344960
|
9.15
|
0.84
|
1
|
0
|
Sant Kabir Nagar
|
1420226
|
3
|
341154
|
24.02
|
0.83
|
1
|
2
|
Rae Bareli
|
2872335
|
7
|
340129
|
11.84
|
0.83
|
1
|
0
|
Ambedkar Nagar
|
2026876
|
5
|
332212
|
16.39
|
0.81
|
1
|
0
|
Agra
|
3621702
|
9
|
323634
|
8.94
|
0.79
|
1
|
1
|
Etah
|
2760350
|
7
|
319386
|
11.57
|
0.78
|
1
|
0
|
Deoria
|
2712650
|
7
|
308731
|
11.38
|
0.75
|
1
|
1
|
Fatehpur
|
2308384
|
6
|
307047
|
13.30
|
0.75
|
1
|
0
|
Basti
|
2084814
|
5
|
306540
|
14.70
|
0.75
|
1
|
0
|
Faizabad
|
1701513
|
4
|
304434
|
17.89
|
0.74
|
1
|
0
|
Shrawasti
|
855985
|
2
|
301117
|
35.18
|
0.73
|
1
|
0
|
Ghazipur
|
3037582
|
7
|
300327
|
9.89
|
0.73
|
1
|
2
|
Unnao
|
2700324
|
6
|
296780
|
10.99
|
0.72
|
1
|
0
|
Baghpat
|
1163991
|
3
|
287871
|
24.73
|
0.70
|
1
|
1
|
Firozabad
|
2081752
|
5
|
260414
|
12.51
|
0.64
|
1
|
1
|
Farrukhabad
|
1570408
|
4
|
232599
|
14.81
|
0.57
|
1
|
1
|
Kannauj
|
1388923
|
3
|
219104
|
15.78
|
0.53
|
1
|
0
|
Ballia
|
2761620
|
7
|
181553
|
6.57
|
0.44
|
0
|
0
|
Kaushambi
|
1293154
|
3
|
174698
|
13.51
|
0.43
|
0
|
0
|
Chandauli
|
1643251
|
4
|
168281
|
10.24
|
0.41
|
0
|
0
|
Mathura
|
2074516
|
5
|
167628
|
8.08
|
0.41
|
0
|
0
|
Sant Ravidas Nagar
|
1353705
|
3
|
161962
|
11.96
|
0.40
|
0
|
0
|
Mirzapur
|
2074709
|
5
|
158204
|
7.63
|
0.39
|
0
|
0
|
Gautam Buddha Nagar
|
1105292
|
3
|
156415
|
14.15
|
0.38
|
0
|
0
|
Jalaun
|
1454452
|
3
|
146317
|
10.06
|
0.36
|
0
|
0
|
Kanpur Dehat
|
1563336
|
4
|
145525
|
9.31
|
0.36
|
0
|
0
|
Mahamaya Nagar
|
1336031
|
3
|
134851
|
10.09
|
0.33
|
0
|
0
|
Jhansi
|
1744931
|
4
|
129785
|
7.44
|
0.32
|
0
|
0
|
Banda
|
1501602
|
4
|
126203
|
8.40
|
0.31
|
0
|
0
|
Etawah
|
1338871
|
3
|
95926
|
7.16
|
0.23
|
0
|
0
|
Mainpuri
|
1596718
|
4
|
84577
|
5.30
|
0.21
|
0
|
0
|
Auraiya
|
1179993
|
3
|
83719
|
7.09
|
0.20
|
0
|
0
|
Hamirpur
|
993792
|
2
|
83064
|
8.36
|
0.20
|
0
|
0
|
Sonbhadra
|
1504852
|
4
|
79102
|
5.26
|
0.19
|
0
|
0
|
Mahoba
|
758379
|
2
|
47335
|
6.24
|
0.12
|
0
|
0
|
Lalitpur
|
977734
|
2
|
28796
|
2.95
|
0.07
|
0
|
0
|
Chitrakoot
|
801957
|
2
|
27168
|
3.39
|
0.07
|
0
|
0
|
Total
|
166197921
|
403
|
30740158
|
18.50
|
75
|
75
|
55
|
Methodology of seat reservation
Entitlement of Seats for Muslim = Proportion of Muslim Population to Total multiplied by 403
(403 i.e. total Seats in the Legislative Assembly)
(403 i.e. total Seats in the Legislative Assembly)
Proportion of Muslim 0.1850
Total Assembly Seats 403
Total Assembly Seats 403
Seats for Muslim in Assembly = 0.1850x 403 = 75
Seats for Muslim in District = Population of Muslim in District X 75
Population of Muslim in State.
Seats for Muslim in District = Population of Muslim in District X 75
Population of Muslim in State.
No comments:
Post a Comment